PRECIPITATION FORECAST · PYTHON
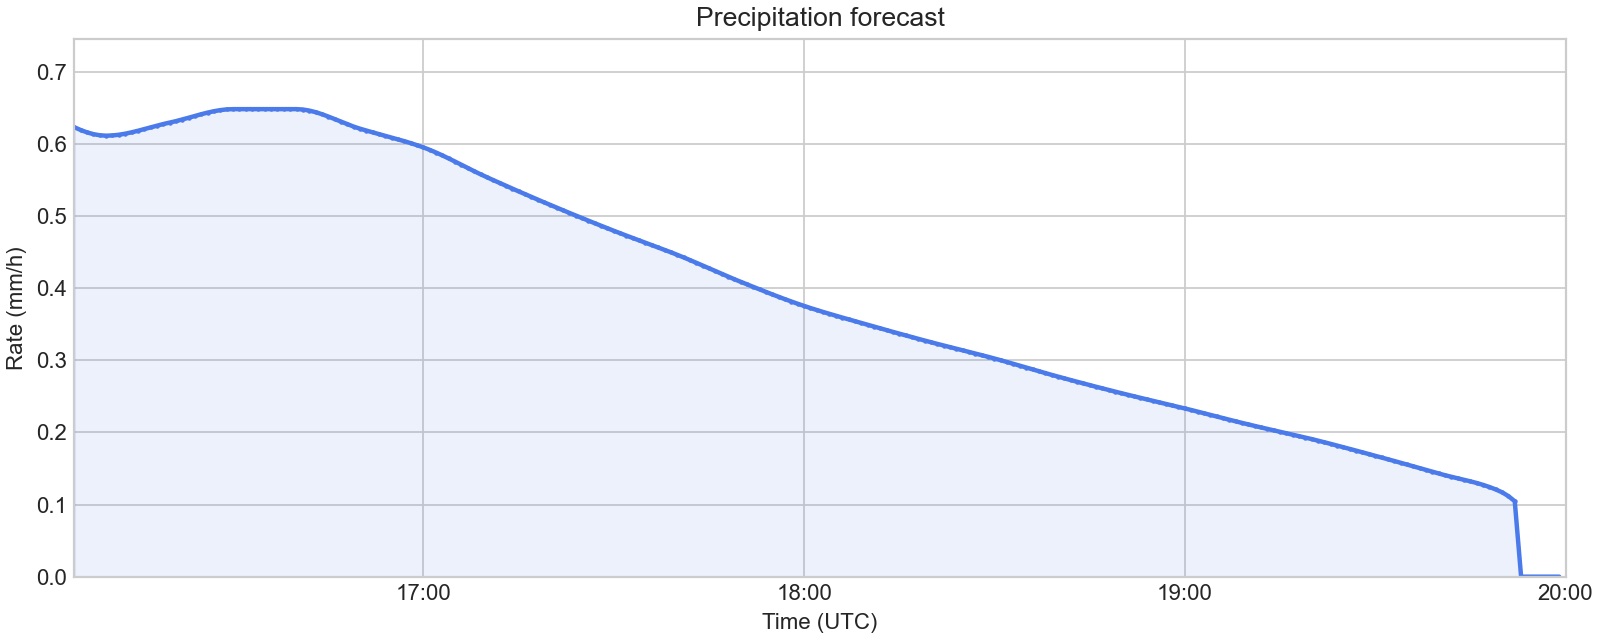
Plot a nowcast
Display precipitation rates as a line, minute bars, or an intensity strip.
Open example →PRECIPITATION FORECASTS FOR DEVELOPERS
Minute-by-minute rain and snow forecasts for the next four hours. Add precipitation rates and types to weather apps, outdoor planning tools, and dashboards.
Start free · 10,000 shared calls / month · No credit card
START WITH AN EXAMPLE
Turn minute-by-minute precipitation data into a chart with Python.
Display precipitation rates as a line, minute bars, or an intensity strip.
Open example →FROM KEY TO FORECAST
Choose a location and read its forecast as JSON.
Create an account, activate the Free plan, then copy your key from API Keys. Follow Getting Started →
Set your API key as an environment variable and enter the longitude and latitude for your location.
Read each interval’s precipitation rate and type, or use the summary intensity in your app.
Precipitation and global precipitation endpoints return forecast intervals, precipitation types, and an intensity summary. See the reference for coverage and request parameters.
Nowcast, Weather, and Tiles APIs share one monthly allowance. Start with 10,000 calls on the Free plan.